
A Guest Post to Boston Biotech Watch by Christoph Bieri, Managing Partner, Kurmann Partners*
This year will see an unprecedented number of biotech IPOs at a record high investment volume. But is it wise to invest in them?
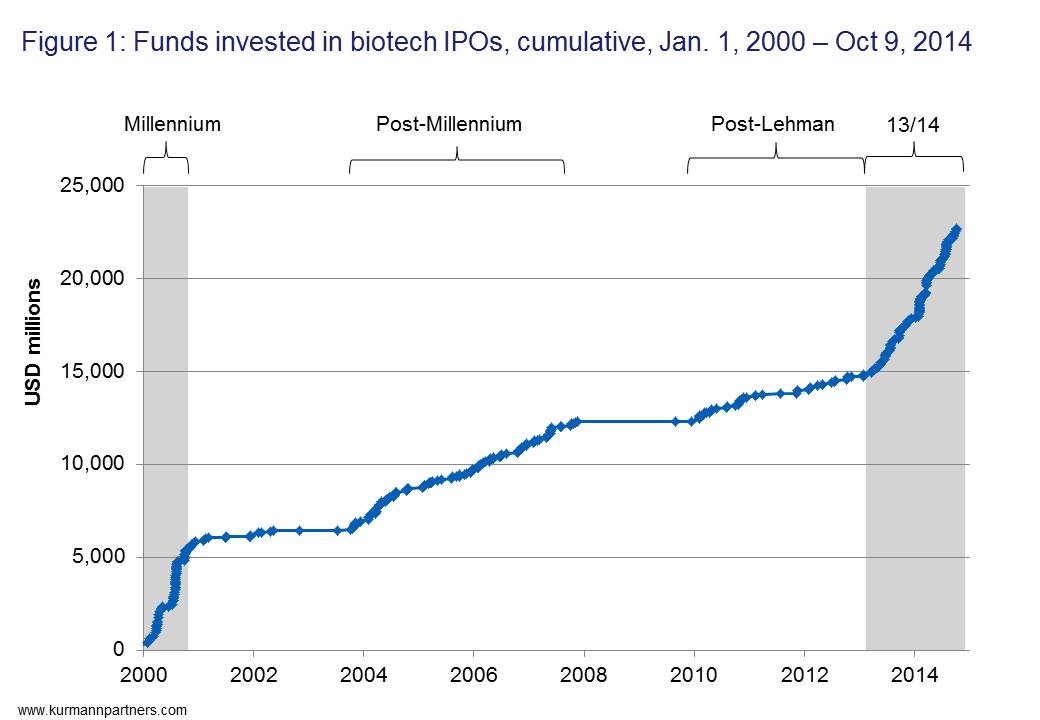
We tracked the performance of about 350 biotech and life sciences companies which listed on NASDAQ, NYSE, LSE/AIM and the Swiss Exchange SIX beginning in 2000. As shown in Figure 1 below, we would divide those fourteen years into four distinct phases:
- The years 2000 and 2001, which we call the “millennium vintage”
- The years 2003 to 2007, the “post-millennium”
- The years 2010 to 2012, the “post-Lehman”
- The current period, the “13/14 boom”
We then tried to estimate the performance of each newly issued stock. Our model assumed that somebody invested at the IPO and held the shares until today, until the company was bought or until it went out of business. We calculated the gains or losses made under these assumptions, correcting for stock splits where applicable. Grouping the individual performance by the date of IPO in the above phases results in Figure 2:
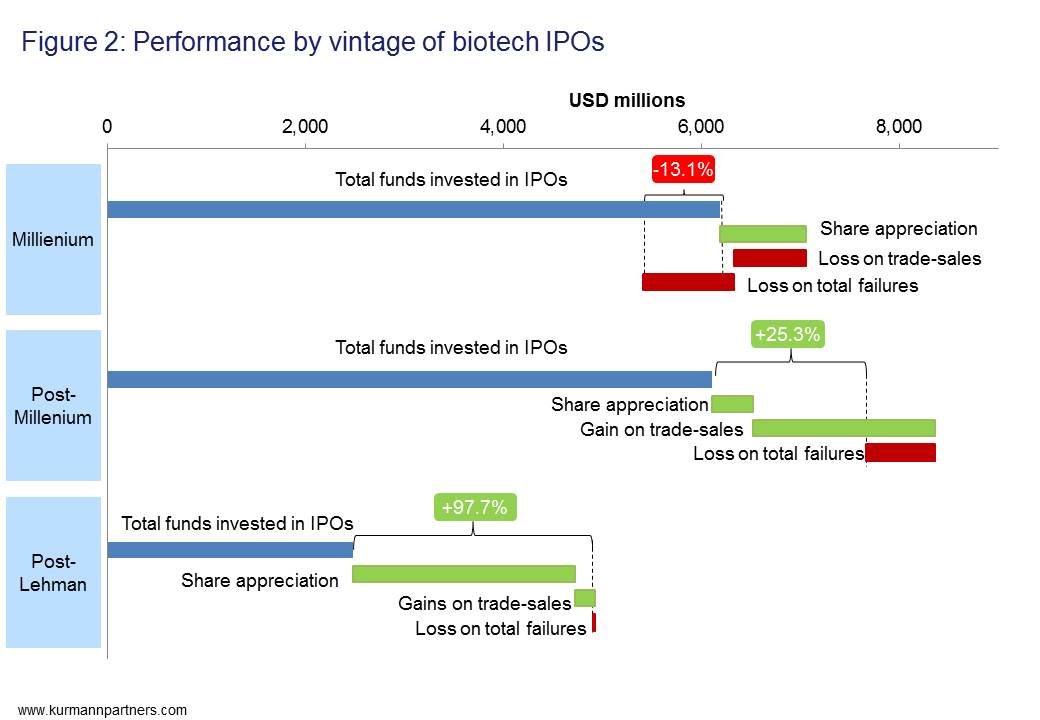
You can read the bar graph top to bottom. The top blue bar represents the total of all amounts invested at the IPO. This is followed in light green with the total appreciation (or depreciation) of the share price until today (October, 2014) if the respective company is still listed. In case the company was sold, the next bar (in red or green) shows the profit or loss the initial investors made. The next red bar reflects the total funds invested in those companies that later went bankrupt. The net of all of these changes is shown above as gain or loss in percentage of the total investments made.
As you can see, the millennium vintage did not perform well at all. In our (simplified) assessment, investors on average took a loss. According to our analysis, the best vintage was those companies that went public in the extremely risk-averse climate post the 2008 Lehman Brothers bankruptcy. As of today, those investments have almost doubled.
We admit that there are many caveats to our analysis. The biggest factor skewing this analysis is what we see as the current valuation inflation, which has had a disproportionate effect on those companies that listed in the post-Lehman phase (hence the big contribution of “share appreciations” to the net gain). Also, those companies which went public post-Lehman had less time to go out of business, so to speak. We may have missed stock splits (reverse or “real”) or some of the other tools which companies resort to when in dire straits. We did not account for cash pay-outs, and secondary offerings, non-dilutive funding or licensing transactions are also not included. But we think we still got a pretty clear picture.
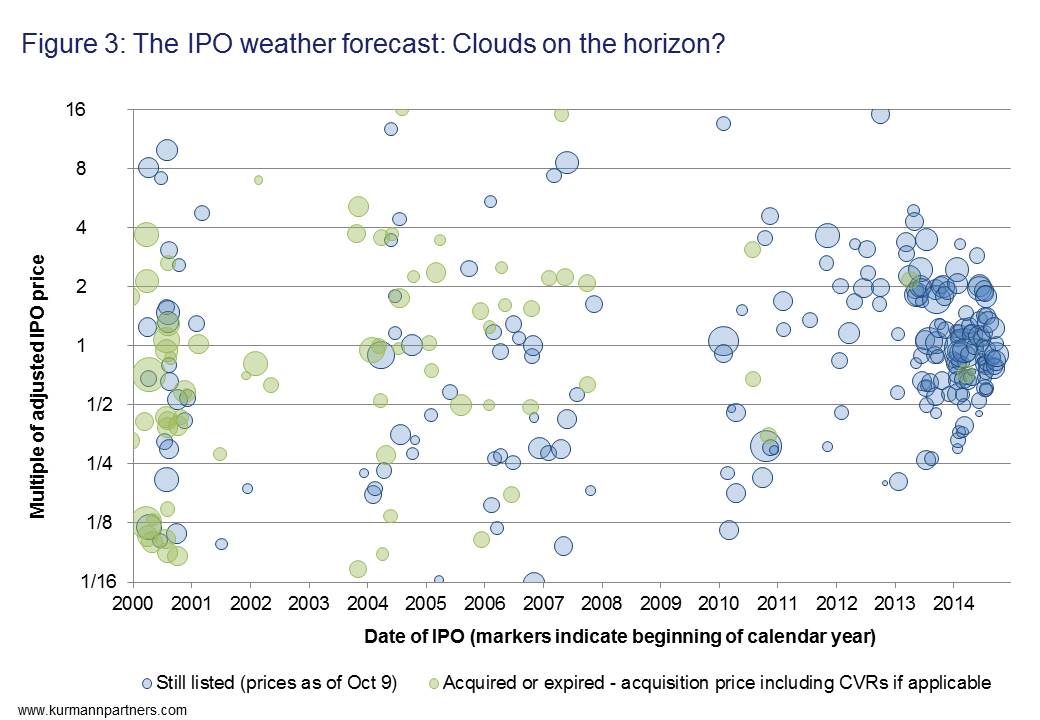
Figure 3 puts the current climate into context. This chart shows IPOs on a time axis. The bubbles indicate the size of the initial offering in millions of US dollars. The y-axis gives the stock appreciation as of today (or until acquisition) on a logarithmic scale. Not surprisingly, the “cloud” of new IPOs of the 13/14 boom are still clustered around the 1x mark on the y-axis since they have not gained or lost much value in this short time. We can also see the diverse fate of the millennium vintage, when a similar IPO boom took place.
Is the current frenzy just the “return to a healthy normal”, as some industry leaders say? Or is it “the folly of year 2000 all over again”, as some others state? We don’t know.
Biotech always makes for exciting investments, in all shades of the word “exciting”. The combination of money, science and the potential to be part of something really new and important may be satisfying all by itself for some private investors. So there is the fun factor (if you can bear the potential losses). Those who intend to profit will spread their risk broadly and time their investments carefully.
# # #
*Kurmann Partners is an M&A and strategy advisory firm based in Basel, Switzerland, advising globally on mid-market transactions in the Pharma, Biotech and MedTech industries.

Hi Christoph,
Interesting! Didi you try to normalise your millennium and post-millenium periods to the same number years that you have post-Lehman? …and if so, how did that look?
BR Søren Lemonius, Partner, Sunstone Capital
Hi Soren,
thanks for your feedback.
Our point was to check whether we could discern distinct IPO-phases (which there are) and check within these phases the performances. In terms of pace and amounts invested the last 18 months compare with 2000/01, as expected.
Normalizing the performances to the periods will yield (lower) “normalized” absolute numbers but the same relative performance for the total. Also, I think one should be careful not to try to read too much out of the data – many things changed since 2000/01, and the market seems to be much more sophisticated today.
Best,
Christoph